Number of Films Produced in Five Countries | IELTS Report Sample
The graph below shows the number of films produced by five countries in three years. Summarise the information by selecting and reporting the main features, and make comparisons where relevant.
Sample report
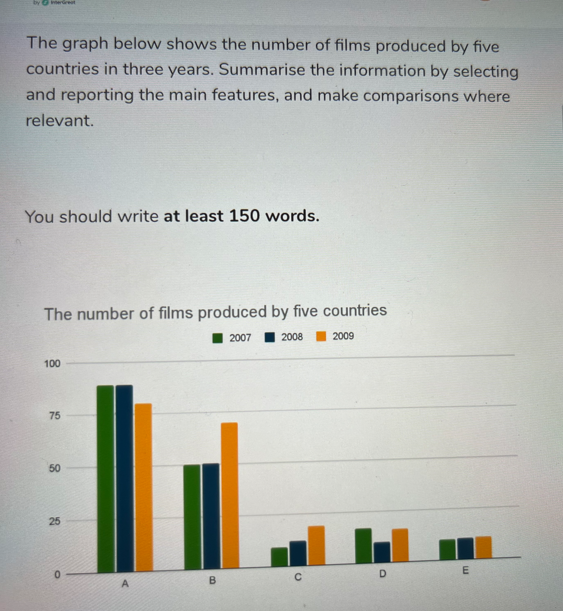
The graph illustrates the number of movies that five countries produced in the years 2007, 2008 and 2009. Overall, it can be seen that in all the three years country A was the biggest producer of movies. While they produced about 90 movies each in the first two years, that number dropped below 80 in year 2009. Country B was the second highest producer of movies. In the first two years, they produced 50 movies each. In 2009, that number increased to around 70. The other three countries did not produce many movies. Country C, however, registered a gradual increase in the number of movies produced throughout the given period. While they produced fewer than 10 movies in 2007, by 2009, they had nearly doubled that number. The movie output of Country D was not much bigger than that of Country C. They produced around 15 movies in 2007. That number fell to 10 in the next year and then climbed back again to about 15 in 2009. In all the three years, Country E produced the fewest films. Their annual production of movies never went above 10.
Analysis
This report seems to be in the band 8 to 8.5 range. Task response is good. There aren’t many grammar mistakes. Overall, this is a good report and the writer has addressed all aspects of the task.
Strategies for Academic Writing Task 1
Use formal language. Your task 1 report should be written in a formal style. Use appropriate vocabulary to describe trends, changes or processes.
Write at least 150 words.
If the visual input gives information about the past. use past tense in the report.